Analytics
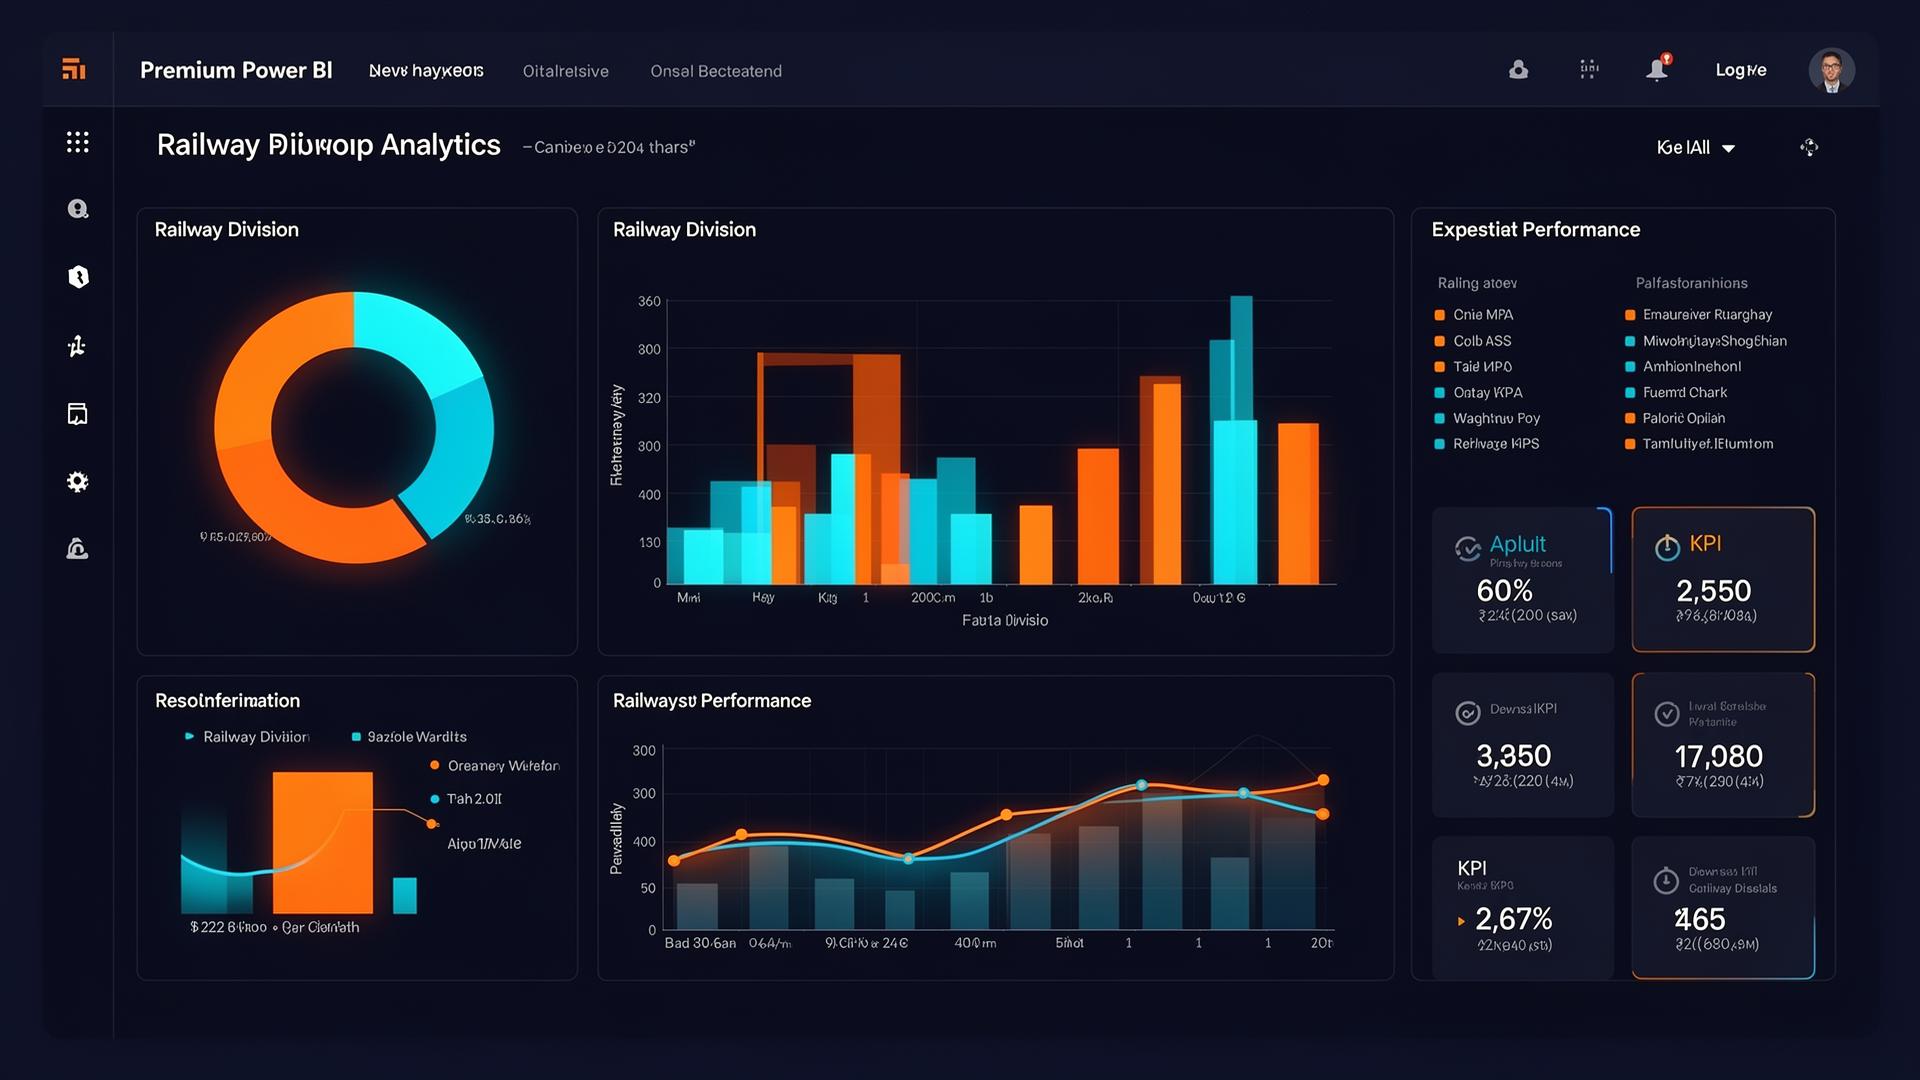
Power BI–grade dashboards, purpose-built.
Every interaction in RailLMS becomes a signal — feeding live dashboards designed for Sr. DOM strategic reviews and daily TI standups.
Active Users
24,580
+12% vs last month
Pass Rate
91.4%
Division avg
Engagement
+38%
Last 30 days
Top Performers
1,204
Above 90% score
TI-wise Completion
TI-East Section94%
TI-West Section88%
TI-Central Yard76%
TI-North Depot82%
TI-Goods Shed69%
Performance Mix
91%
- High performers — 58%
- On-track — 26%
- Need support — 16%